Designing a Custom Real Estate Dashboard in Figma
How about keeping track of your property listings, sales forecasts, and earnings stats all on a single page? This would give you a quick overview of your latest listings and achievements over a specified period. We’re talking about a UI/UX design (crafted in Figma) that will change the way you think about how a real estate dashboard should look. This is our first blog post in the ‘Dashboards’ category, where we’ll be sharing exciting concepts and designs, starting with our design philosophy for this real estate dashboard in Figma.
Why Custom Dashboards are Essential for Real Estate Applications?
Who doesn’t want a quick snapshot of how their agency or company is performing? Custom designed/developed dashboards are tailored specifically to your business needs, making it easier and faster to access key details and track progress in one place. They offer a streamlined way to view essential data, helping you stay on top of your real estate operations.
What The UI Studio’s Custom Real Estate Dashboard Brings to You with UI/UX Design Excellence Using Figma
Our team conducted extensive research to identify what real estate business owners feel is lacking in their existing CRM (Customer Relationship Management) portals. It’s not that The UI Studio performed any miracles with our UI/UX Figma expertise, or created something impossible. We simply focused on making the dashboard more engaging by addressing a few gaps, organizing and placing things where they make the most sense. Let’s dive in and explore how this approach enhances the user experience and outperforms other solutions available in the market. For us, aesthetics are just as crucial as user experience.
Enhancing User Experience By Sharing Real Time Data
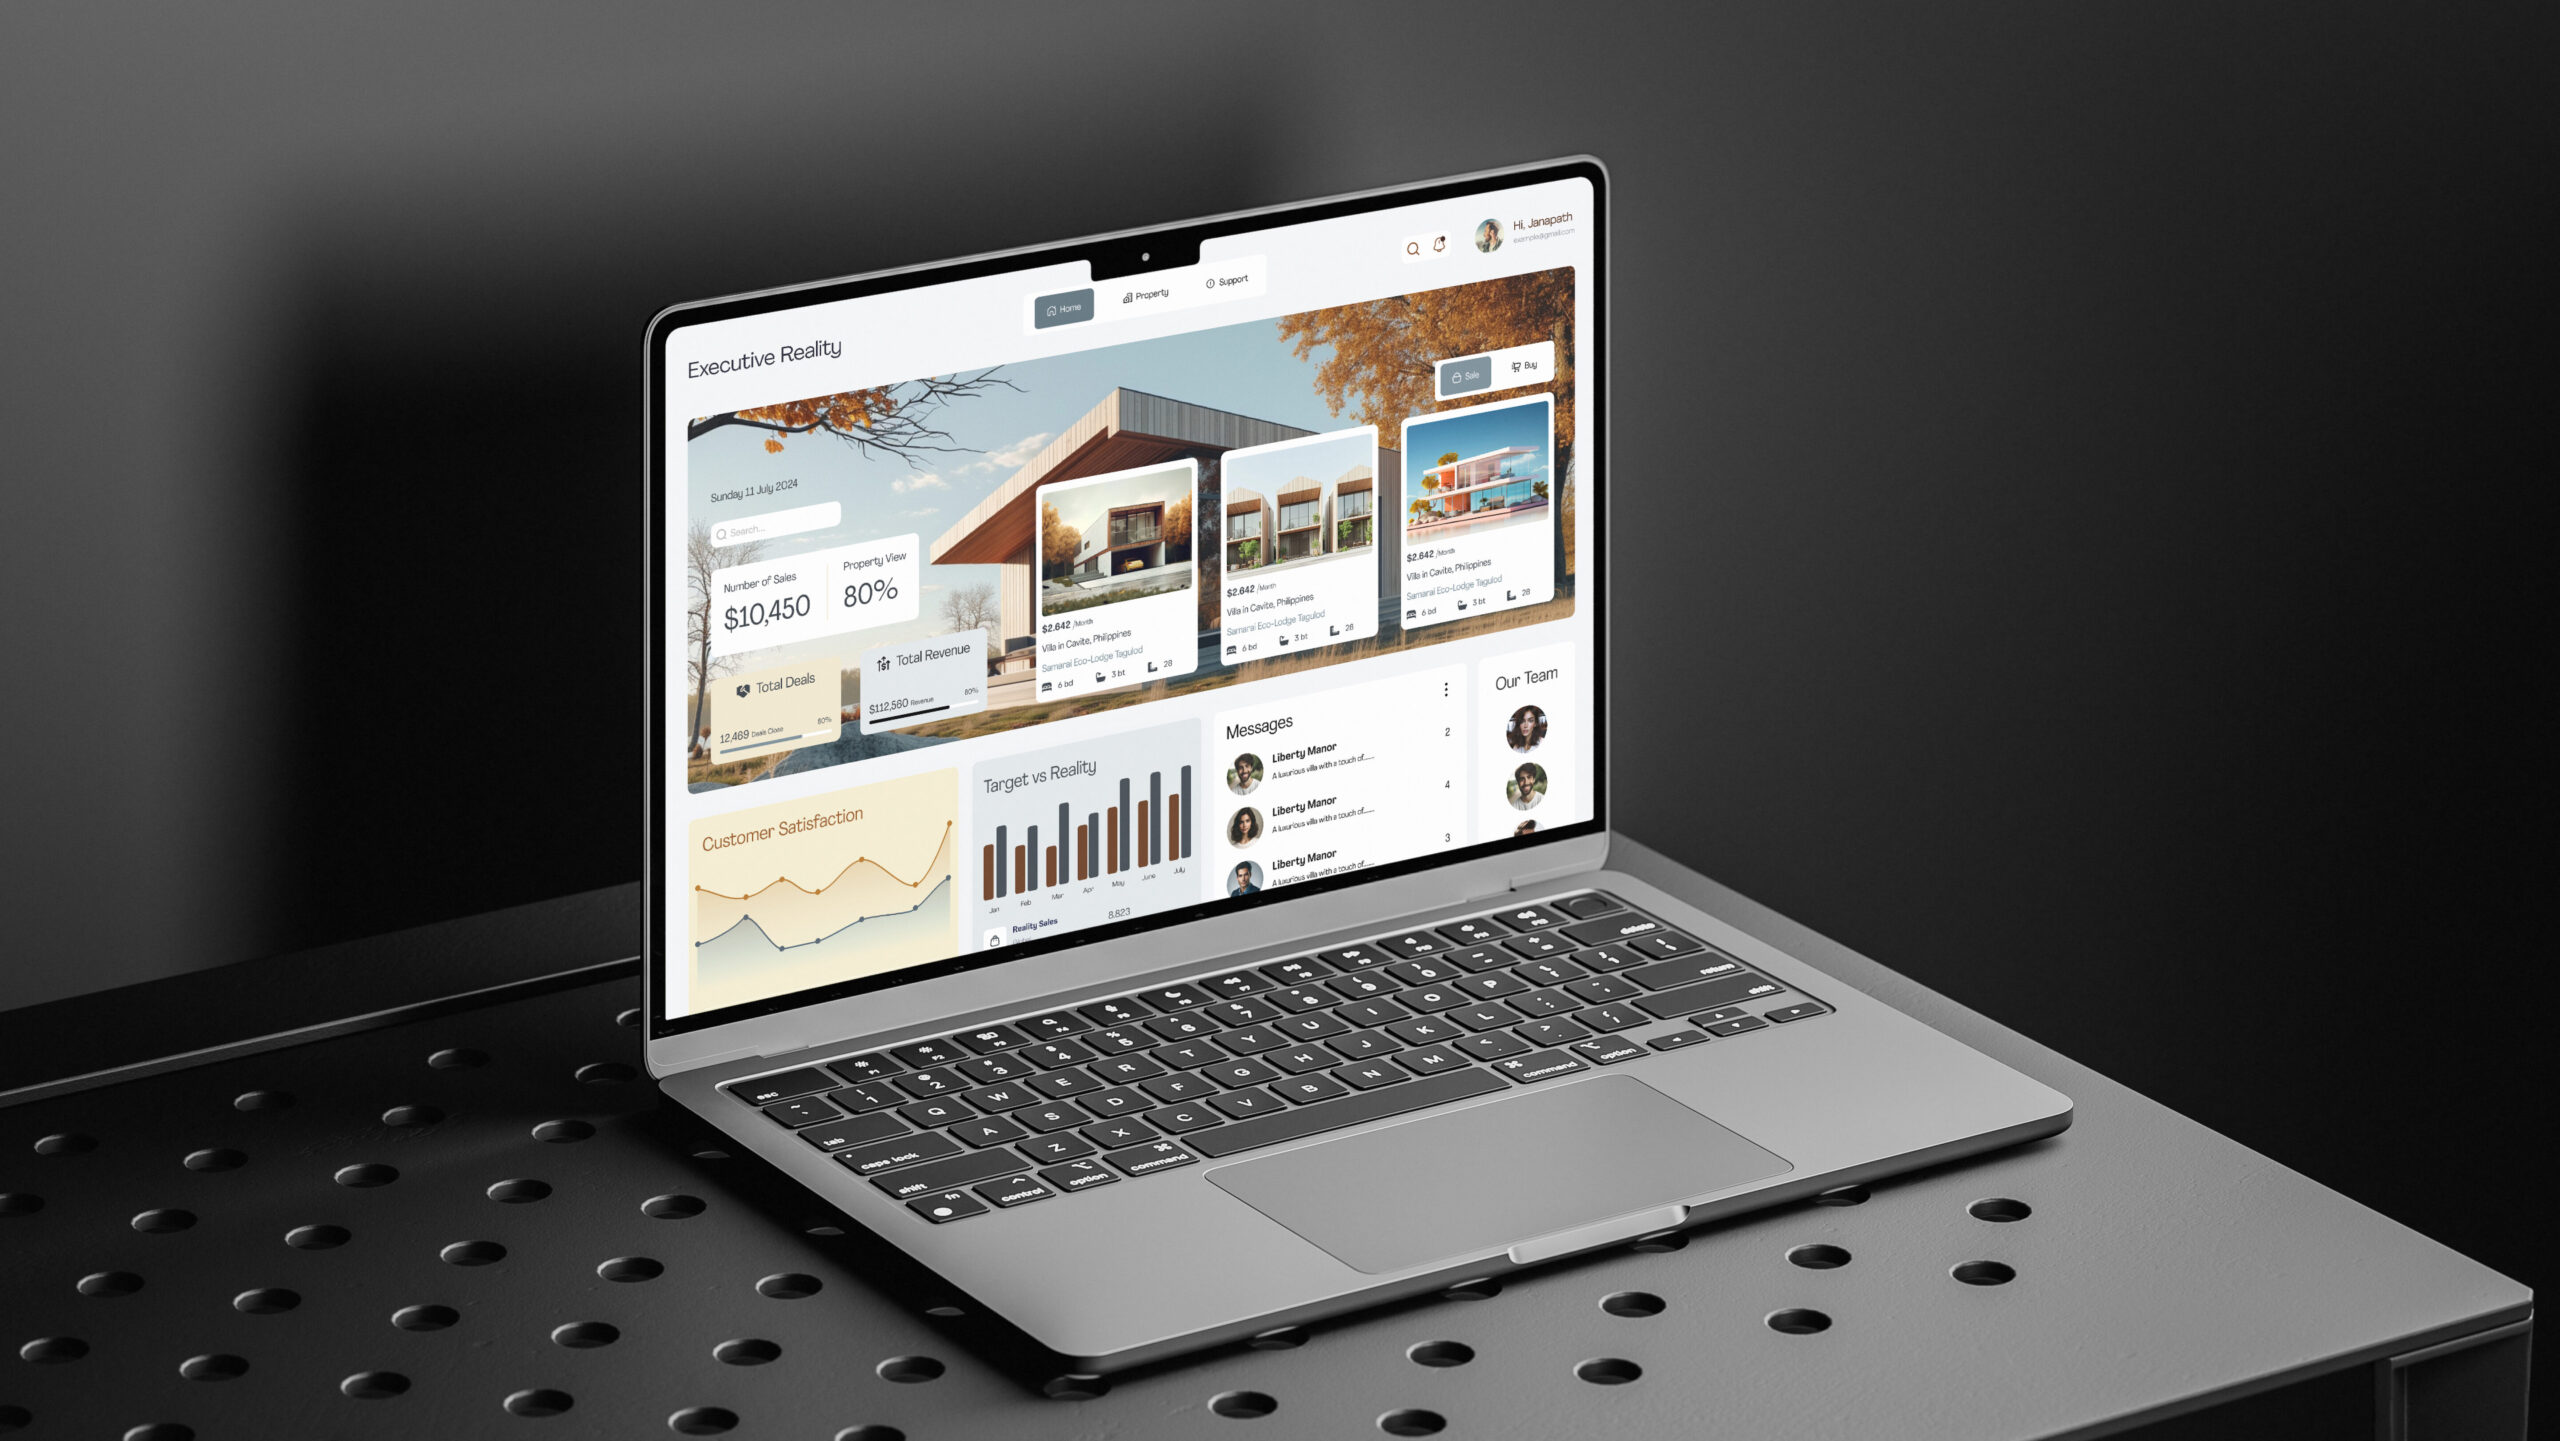
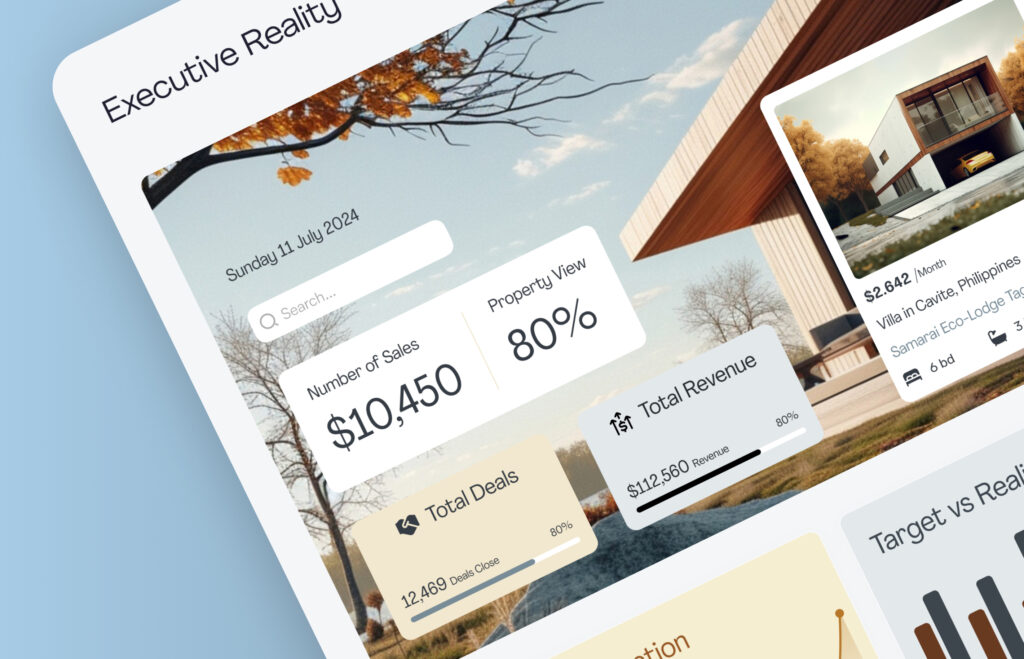
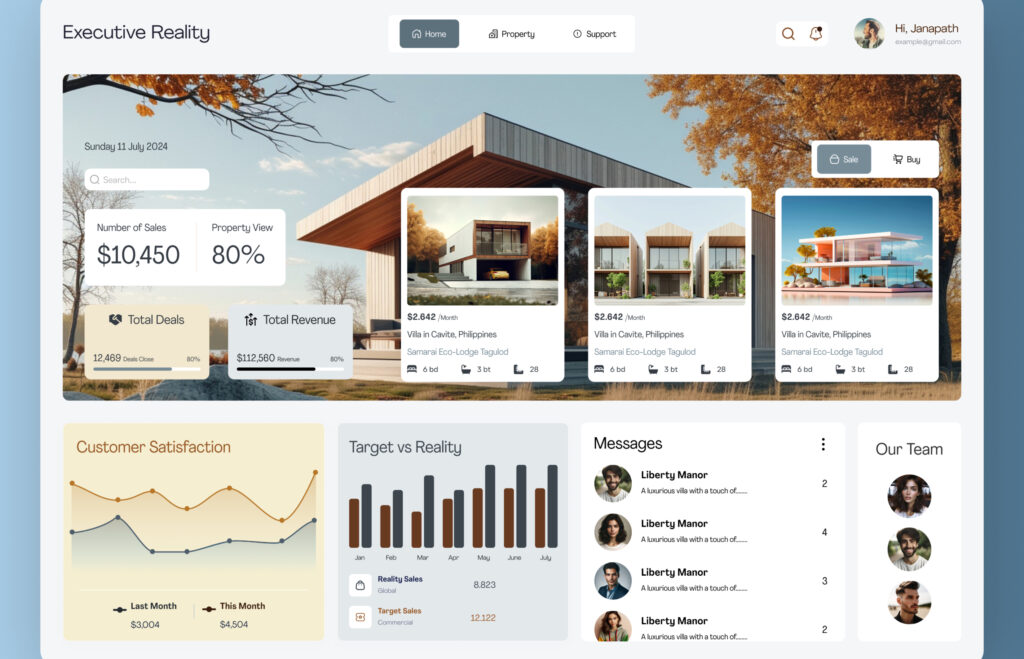
We decided to prioritize real-time data at the top of the dashboard, not just for numerical stats (e.g., earnings), but also to highlight top performing or recently listed properties alongside those numbers. When you take a closer look, you’ll see:
- Number of sales for the specified time/date
- Real time unique views of the properties
- Total deals closed
- Total revenue earned
- Property listing
Enhancing Data Forecasting, Customer Satisfaction, and Team Overview with UI/UX Design in Figma
Right after the quick stats, our Figma experts introduced a customer satisfaction graph and a sales forecasting section that compares targets with actual results. For example, it shows the sales numbers you expected versus what you achieved, derived from your data. When this UI design is implemented on the front end, these stats can be fetched from an API or passed from the controller to the view. Additionally, we included a section for chats with your customers and your team, providing seamless communication tools.
How to Update your Existing Real Estate Dashboard Design?
At The UI Studio, our process for upgrading your dashboard design is structured and collaborative:
- Analyze Your Current Dashboard
- Our experts thoroughly investigate your existing data flow, metrics, and overall functionality to identify areas of improvement.
- Understand Your Requirements
- We schedule meetings to gather your feedback and understand what changes you want, including specific features or improvements you envision.
- Create a Comprehensive Plan
- Based on our analysis and your inputs, we prepare a detailed report that outlines how the updates can be implemented. This includes wireframes to visualize the proposed changes.
- Design the New Dashboard
- After your approval of the wireframes, our team crafts a custom UI/UX dashboard design in Figma, ensuring it aligns with your goals and enhances user experience.
- Deliver the Final Design
- We provide the completed design files, which you can hand over to your developer for integration into your portal.
This step-by-step approach ensures a smooth transition from your current dashboard to an upgraded version tailored to your needs. We are just a message away.
Our Instagram Community is Growing – See Our UI/UX and Figma Creations
We’d love to hear your thoughts! We’re building a vibrant community on Instagram where we share our latest UI/UX and Figma creations. Follow us to stay updated on our modern and innovative designs tailored for various businesses.
Get in Touch for Figma Design Help or Ideas
We’re here to assist you with all your Figma design needs! Whether you’re looking for help with a project or want to share your creative ideas, feel free to reach out. Our team is eager to collaborate and bring your vision to life.
Conclusion – Custom Real Estate Dashboard in Figma
Conventional real estate CRMs have been performing well and are used on thousands of devices. However, their dashboards mainly focus on sales data, missing the opportunity to provide a blend of features like property performance (e.g., number of views), sales data, customer satisfaction charts, messaging with customers and team members, and sales forecasting. Additionally, these CRMs often lack flexibility for customization. That’s where The UI Studio steps in, offering custom dashboard design and front-end development services tailored to your needs.